VOGSY Dashboards
Whether you’re a CFO tracking margin shifts or a delivery lead surfacing slippage before it hits revenue.
VOGSY Dashboards put the insight in your hands—without adding tools, complexity, or delays.
Powered by Google Cloud Looker.
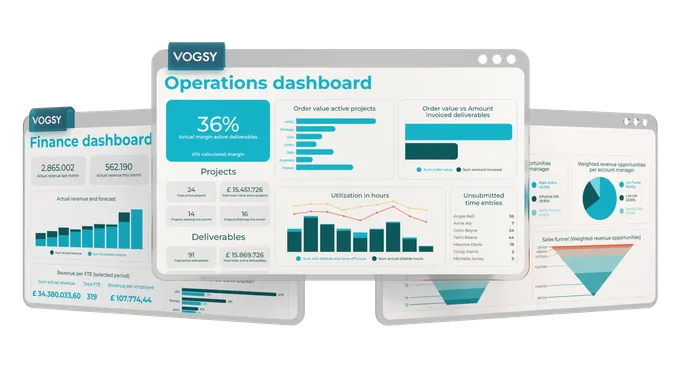
Charts, boards & reports
Visualize your business performance instantly. Leverage out-of-the-box charts and reports to monitor key metrics. Create custom dashboards (Boards) with specific chart selections for different teams, displaying data in local or consolidated base currency.
Business Intelligence data sets
Use the BigQuery datasets to visualize your custom reports and dashboard with the Bl tool of your choosing.
Unlock advanced analytics with your BI tools. Connect your preferred Business Intelligence tools directly to VOGSY’s BigQuery datasets to create highly customized visualizations, reports, and dashboards for in-depth analysis.
Custom charts
Create custom charts to integrate into boards and distribute to your colleagues.
Tailor your analytics to your unique needs. Design and build your own custom charts to visualize the specific data points and metrics that matter most to your business, then easily share them on dashboards with your team.
Boards
Collect your customized charts on boards you can share with your team.
Create personalized dashboards for focused insights. Compile your standard and custom charts onto specific Boards (dashboards) that you can tailor and share with different teams or roles, providing relevant insights at a glance.
Out-of-the-box reports directly into customizable sheets with an easy update function
Reports: Expenses, Forward-looking invoicing, Opportunities, Opportunity bookings, Financial transactions, Time entries, Working hours vs Submitted hours, Leave requests, Leave budgets, Billability employees, Leads, Employees, Resource planned hours, Revenue actual and forecast, Weekly revenue forecast for confirmed projects, Projects, Project Invoices, Deliverables, Accounts receivable, Time entries dataset, Outstanding Invoices, Financial KPIs, Planned vs Actual, Suppliers, Calculations, Accounts payable, Trial Balance, Customers, Draft invoices, Audit trails, Contacts
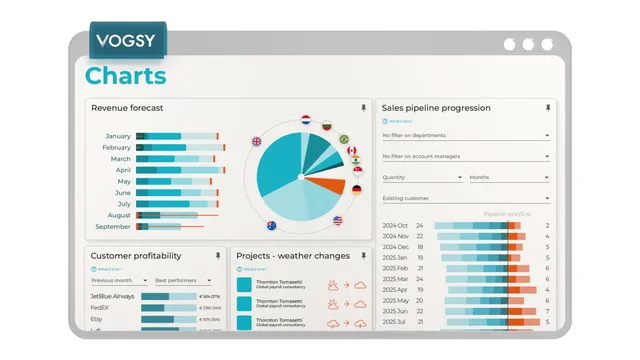
Out-of-the-box, ready-to-use charts
Sales funnel, Sales pipeline progression, Revenue forecast, Opportunities - weather changes, Order intake, Customer profitability, Projects- weather changes, Billable vs. non-billable hours, Billability per month, Billability per employee, Project billability per department, Resource utilization, Project margins, Work in progress, Outstanding invoices, Financial KPIs